I’ve almost got the hang of typing 2019 into things, so we must be well and truly into this year. The start of a new year is a great chance to have a look back at the previous year and see how things are going.
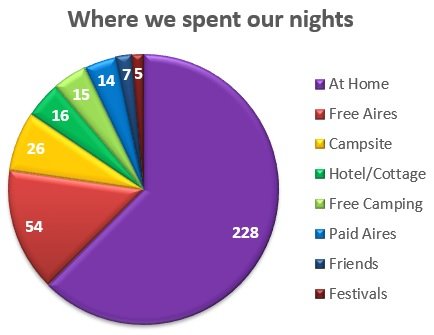
For us 2018 wasn’t a massive year of motorhome travels. As you can see from the chart on the right, we were at home for a large part of the year. We only spent around three and a half months abroad in Zagan, our motorhome. So, if you’re looking for an idea of how much it costs to tour in a motorhome, I’ll point you now to the ‘Motorhome Costs‘ section of this blog where you’ll find loads of information including a breakdown of costs for a year-long tour or a three month tour of France.
Regular readers of this blog will know that our lives are a bit of an experiment. In 2011 we set off and spent two years on the road in our motorhome. During that time we met some amazing people, one of whom introduced us to the wonders of passive income. When we got back home we set ourselves a goal to become financially free – which in simple terms means, we’d have enough money coming in through passive income, to cover what we spend. That would leave us free to travel whenever we wanted. We reached that point in 2015 (we talked about how we did it in this free eBook) and are now living off our investments – the financial freedom experiment. So how is it going?
Factfulness and Tracking
We’ve both recently discovered a fantastic book called Factfulness by Hans Rosling. The key message in the book is that you shouldn’t guess at stuff – base your view of the world on facts (the book has some amazing statistics in it to make you feel much better about things). Why is this relevant to our experiment? Because all of our financial information is based on fact. We don’t ‘think’ we spend around £200 a month of food in the supermarket, we know that we spend £3108.32 a year (an average of £251.53 a month). How do we know this? Because we track everything we spend, and everything we have coming in. We treat our lives like a business, tracking our profits and losses and recording it all on a balance sheet.
This tracking of our income and spending is now an ingrained habit, one that we’ve been doing for over a decade. It helped us to reduce our costs and see that saved money reduce our mortgage as we paid it off early. Tracking also helped us tour Europe for two years on a pot of savings, gain financial freedom and it now gives us peace of mind that our crazy experimental life is working.
So, How Did We Do In 2018?
In case any of you are planning to do this yourselves, it’s probably best if I first give you a short explanation of how we track our money. Every goes onto one of three pages on my spreadsheet – Income, Fixed Costs and Living Expenses.
[gview file=”https://ourtour.co.uk/home/wp-content/uploads/2018/12/Blank-Tracker-Spreadsheet.xlsx”]
Income is everything we have coming in, and everything going out is either a Fixed Cost or Living Expense. Our Fixed Costs are what we need to spend in order to keep our income coming in. I split our Fixed Costs out from our day to day Living (and travelling) Expenses because we set ourselves an annual budget of £15,000 for this (not including household bills – see below for more details). Although we don’t stick to our budget rigidly, we use it as a weekly sense check – after all this is an experiment and it’s best to know early if things are going awry. In 2018 we had 21 weeks where we were ‘over budget’, but then we had weeks where we hardly spent anything, so it all balanced out in the end.
![]()
How did we do against our £15k per year living expenses budget?
When we had to have Charlie (our canine family member) put down in June of 2018, we sat down and talked a lot about our lives. Charlie was a fantastic travel companion, but he did stop us from doing some things and going to some places as we couldn’t leave him alone for long. We knew Charlie put some restrictions on our lives, we didn’t mind as he was worth it, but we didn’t know how our £15k budget would stand up now that he was no longer with us.
We decided to up our annual budget to £20k (not including household bills) and as we were already halfway through the year, we’d expect to end up spending £17,500 in 2018. We failed. Even though we bought everything we wanted and went to the places we wanted to, we still only spent £16,060.63, so we ended up £1439 under budget, that’s over 8%! This was really surprising to me as I didn’t feel as if there was anything else I would have wanted to spend money on.
Living Expenses and Household Bills
When I track our Living Expenses they include our bills at home, but we don’t count them in our ‘annual budget’. In 2018 our annual bills at home were £1855.47, but this is because we rent out rooms in our home back in the UK, and split the bills with our tenants. If you are thinking of doing this too and plan to keep a place back home, unless you also share the bills you’ll need to include more money to cover these costs. Again, this is where tracking can really help you as it’ll give you a full picture.
What did we spend our money on?
Surprisingly it’s almost identical to when we are spending more time travelling. Around 25% of our total Living Expenses (including the household bills), goes on food (just over 17% at the supermarket and 8% eating out), 11% is the household bills, 8% is fuel (diesel or petrol), and 7% goes on nights away – campsites, cottages, hotels, aires etc. We spent a bit less on repairs for Zagan the motorhome this year, but we had use of my Mum’s car and spent some money on that – so again it all adds up to about the same.
Is our crazy financial freedom experiment working?
That is the BIG question! At the moment, we think it is. We’re certainly enjoying the time freedom we have in our lives (I’m typing this in our motorhome in Spain before we head out for a tasty Menu del Dia for lunch!). Not having to go to work every day means we can spend our time doing whatever we want.
But here’s the magic part. If we look at our Income for 2018 and our Fixed Costs and Living Expenses – we are spending less than we earn. I find this amazing because we now earn so much less than we did in our previous lives.
![]()
That red box on the chart shows us that in 2018 we didn’t spend 19% of our income. We lived on just 81% of what we had coming in. That’s money that we can invest in more assets to generate more income for us. Jay once called it a spiralling wealth machine, I simply call it magic.
Ju x


